


As expected since the end of July, demand is trending down, but the week-on-week (WoW) decrease for 21-27 August 2022 continued to be less than what was observed in previous years.
NB: This is an article from STR
More importantly, this was the highest demand ever recorded for this specific week dating back to 2000. Weekly demand was equal to 2019, but that level was easier to meet because that was the week ahead of the Labor Day holiday that year. The opposite of that holiday calendar shift will be true in the data that STR processes next week.
Subscribe to our weekly newsletter and stay up to date
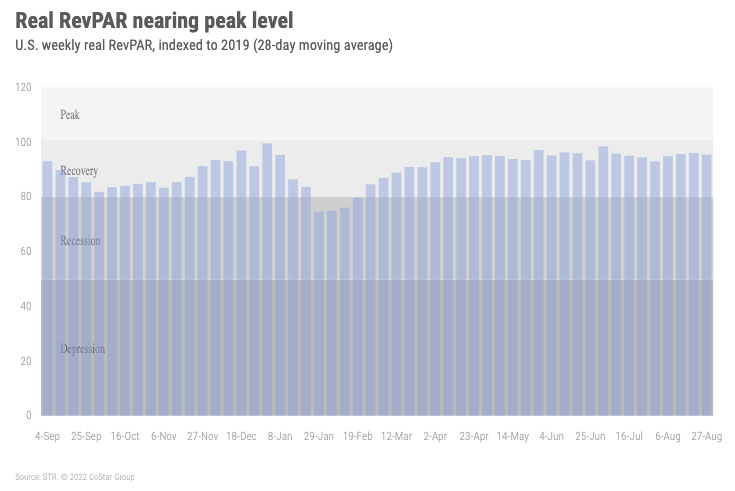
Weekly occupancy was 65%, which was 1.7 percentage points lower than in the comparable week of 2019, but remember that supply is up 2.6% since over that time. Nominal average daily rate (ADR) decreased 2.6% WoW to US$147 but was 15% higher than 2019 and 11% higher than a year ago. Nominal revenue per available room (RevPAR) fell 5.9% WoW to US$96, which was 12% greater than in 2019 and 18% higher than a year ago. Real (inflation-adjusted) ADR was one percent lower than in 2019 whereas real RevPAR was three percent lower than in 2019 and unchanged from a week ago.
Weekly demand fell 3.4% as compared to -6.8% in 2011, a year with the same calendar composition as 2022. Excluding 2020, the average weekly demand decrease for this specific week over the past 21 years has averaged -6.1% or roughly -1.4 million rooms. At -898,000 rooms, the decline was the lowest for this particular week going all the way back to 2000 (excluding 2020).
So, what changed? Top 25 Market and Group weekday (Monday – Wednesday) demand increased. The latter may be early confirmation of what clients have been telling us about a strong Fall conference season. Weekday Group demand among Luxury and Upper Upscale hotels was up 10% WoW and reached the third highest overall volume since 2000, behind 2016 and 2019. In the Top 25 Markets, Group demand saw a similar ranking and increased 14% WoW. Seventeen of the Top 25 Markets saw weekday Group demand increase WoW, including Atlanta, Dallas, Orlando, New York, San Diego, and San Francisco.
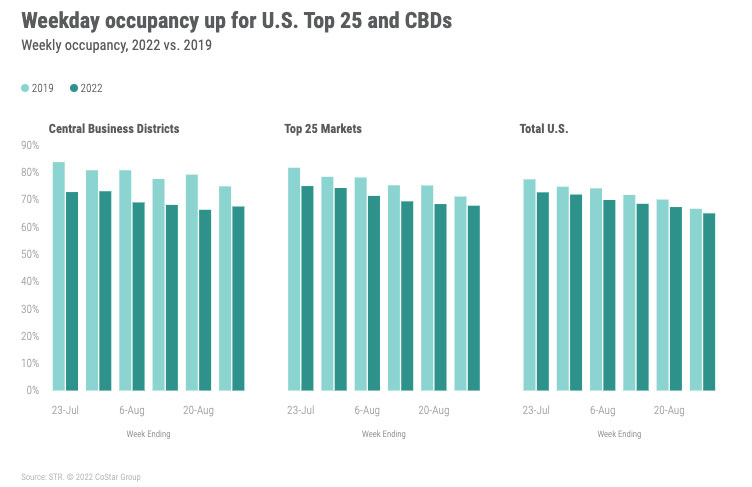
Weekday occupancy for the Top 25 Markets increased, for the first time in six weeks, by 0.8 percentage points to 67.9%. Eleven of the Top 25 Markets, including Atlanta, Boston, Chicago, Houston, and Philadelphia saw weekday occupancy gains. At 81%, Boston had the highest weekday occupancy among the Top 25. Weekday occupancy for convention and conference hotels in the Top 25 increased 5.4% WoW.
Among the scales within the Top 25 Markets, Luxury (+3%), Upper Upscale (+5%), and Upscale (2%) hotels all saw WoW gains with the remainder continuing to see declines. Weekday demand in large (300+ rooms), urban, Upper Upscale hotels increased 9% WoW.
For the entire week, Top 25 Market occupancy fell 0.6 percentage points due to 1.9% WoW decrease on shoulder days (Sunday & Thursday) as well as a 2.7% decline on the weekend (Friday & Saturday). This year’s Top 25 weekend occupancy continued to be higher than at the same time last year but was just 94% of 2019’s volume. The largest WoW decrease in demand was also on the weekend for non-Top 25 Markets, falling 5.1%. The week-on-week decreases remain consistent with previous years given the start of K-12 schools. According to STR’s 2022-23 School Break Report, 73% of schools had resumed classes.
Unlike the Top 25, central business districts (CBD) saw occupancy gains, up 1.2 percentage points to 67.5%. Weekday occupancy was up 3.5 percentage points WoW while weekend occupancy dropped 1.7 percentage points. Shoulder days were up slightly. Ten of the 20 CBD markets reported weekday occupancy above 70%, with Atlanta (86.1%) leading the way. Austin, Boston, and Denver CBDs also saw weekday occupancy top 80%. The lowest weekday occupancy was seen in New Orleans (33%), which was the market’s lowest level since early in the year. In fact, the entire New Orleans market had the lowest occupancy of any STR-defined U.S. market (45%). Even at its low level, weekly occupancy for the market has been slightly better than a year ago but well below 2019.
At $US$147, nominal ADR was below US$150 for the first time in 12 weeks. The decrease in nominal ADR came mainly from non-Top 25 Markets, where the metric fell 3.7% WoW as Top 25 Market was down by only 1% WoW. Among the non-Top 25, the largest decline was seen over the weekend (-5% WoW).
Weekday nominal ADR among the Top 25 Markets was down 0.6%. By chain scale, the largest weekday drop was in Luxury hotels, where nominal ADR fell 3.6% WoW. Upper Upscale, which benefited by the gain in group travel, saw nominal ADR decrease 0.7% WoW. Group ADR among those hotels was down slightly more at -1.2%.
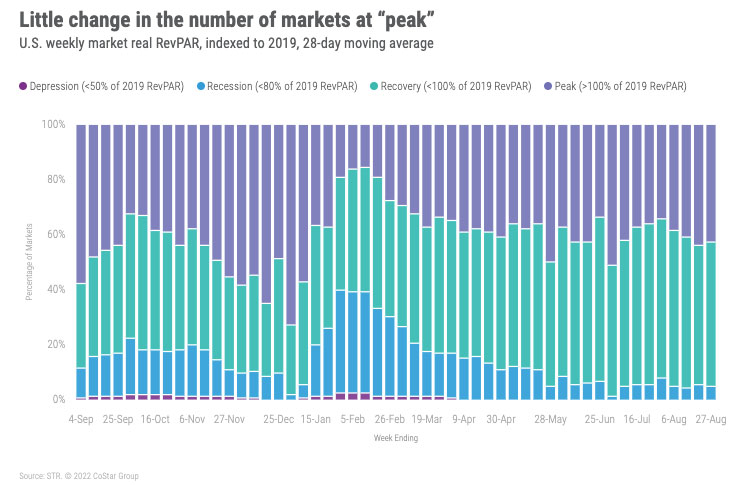
Nominal RevPAR remained well ahead of 2019 in nearly all the 166 STR-defined U.S. markets for the week and in the past 28 days. Real RevPAR, however, was ahead of 2019 in just 71 markets for the week and for the past 28 days. Another 87 markets were in “recovery” with real RevPAR between 80% and 100% of 2019 levels over the past 28 days. Only eight markets were in “recession” with real RevPAR between 50% and 80% of the 2019 level. This was slightly less than a week prior.
Around the Globe
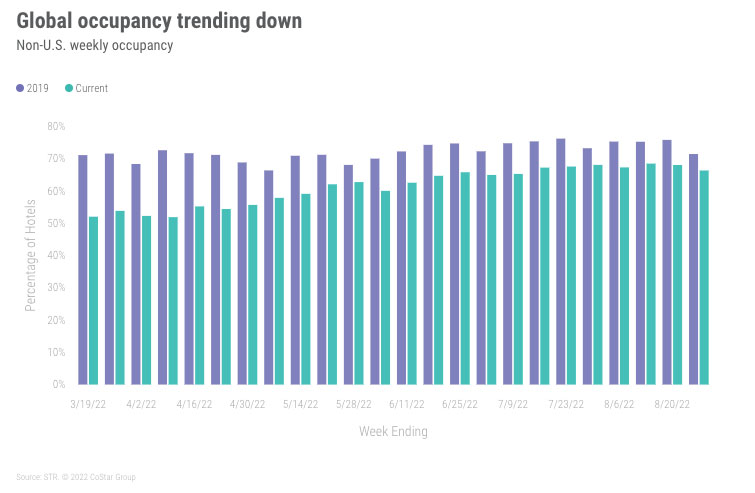
Excluding the U.S., global occupancy reached 66.3%, down 1.7 percentage points from the week before—second consecutive weekly decrease. Nominal ADR and RevPAR also fell (-3.2% and -5.6%, respectively). Of the 103 countries tracked on a weekly basis, 54 collectively lost 2.4 million room nights week on week with China accounting for 54% of the loss. Spain made up 11% of the loss followed by Italy (5%). The remaining 49 countries saw growth led by Indonesia (+210,000), but they collectively did not offset those that lost demand.
With China posting a large demand loss, the top 10 countries by supply saw occupancy retreat to 66.2% from 68.5% a week earlier. Only three countries among the top 10 saw demand growth in the week (Germany, Mexico, and Indonesia). The U.K. continued to have the highest occupancy of the top 10 (79%) followed by Canada (78%) and Spain (75%). China had the lowest occupancy at 59%, which was also the country’s lowest level of the past eight weeks.
China’s demand decline was widespread as 34 of the 43 markets saw demand retreat in the week led by Beijing, where occupancy dropped 13 percentage points WoW to 60%. Occupancy gainers were led by Shanghai, where the measure increased 3.4 percentage points to 61%. Macau also saw growth (30 percentage points) with occupancy rising to 49%, its highest level since February.
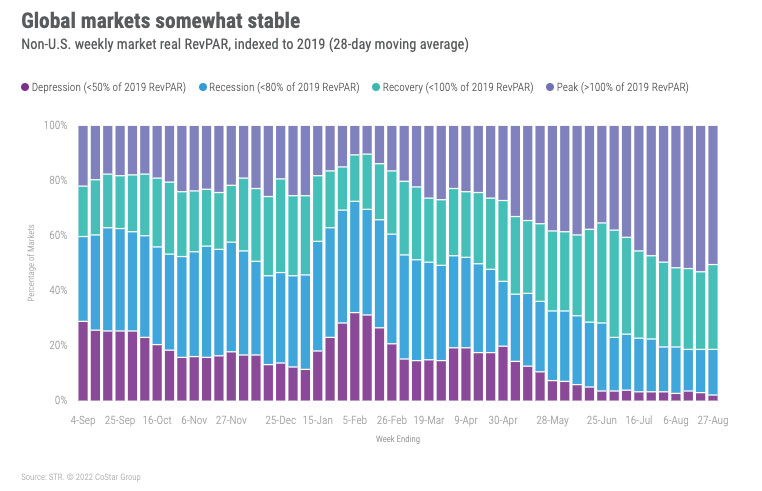
With the dip in performance, the percentage of markets with “peak” 28-day real RevPAR (RevPAR above 2019) fell with 174 of the 344 non-U.S. markets at that level. A week earlier, 183 markets were at peak. The next largest number of markets (106) were in “recovery.” Only seven markets were in “depression” (real RevPAR below 50% of 2019).
Big Picture
While a week does not make a trend, we were pleased to see the week-on-week gain in the U.S. Top 25 Markets and in Group demand during the weekdays. We expected a sharp decrease across all markets and day types. Over the next two weeks, comparisons with 2019 will likely be askew as the Labor Day holiday was a week earlier in 2019. Additionally, 2019 comparisons in several markets will be affected from the landfall of Hurricane Dorian in that year. The final batch of schools are also expected to begin after the Labor Day holiday, further impacting leisure travel in the near term.
The post US Hotel RevPar Still Strong But ADR and Demand Trending Down appeared first on Revenue Hub.


